home
home
 projects
 about
about
 contact
 follow
 feed
feed
 settings

Categories
Sponsors
Archive
 Blogroll
Badges
Community

|

Agentless Monitoring of Nano Server on Azure
Posted in Windows Server | No Comment | 2,531 views | 31/10/2016 13:35
Nano Server monitoring is kind of a challenge for System Administrators. Even if your current monitoring product supports Nano Server, installing agents on Nano could be a headache. In this article, I will show you how to monitor your Nano Server with VirtualMetric’s Bare Metal Monitoring feature. VirtualMetric supports following Windows OS without agent and additional software requirements: * Windows Server 2003/2003 R2
* Windows Server 2008/2008 R2 * Windows Server 2012/2012 R2 * Windows Server 2016 * Nano Server * Windows 7/8/10 VirtualMetric Bare Metal Monitoring provides: * More than 100 Performance Counters (All Customizable)
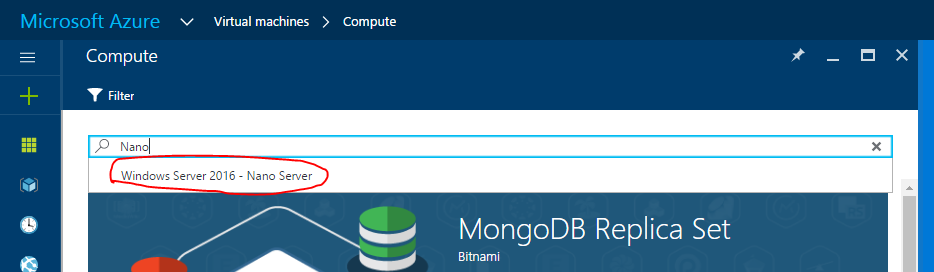
* Hardware Health (Currently supported hardwares are IBM, Dell, HP, SuperMicro, Fujitsu and Cisco) * Change Tracking * Event and Security Log Collection * TCP Activity for Network Based Attacks like DDoS etc. * Firewall Log Collection (Dropped & Allowed Packets) * Assessments like Pending Updates, Hotfixes, Services, Processes etc. First, lets start installing our Nano Server on Azure. 1. Go to your Azure Dashboard and find Nano server in compute:
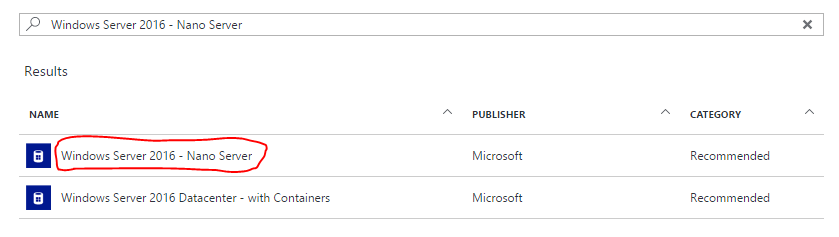
2. Choose Nano Server for installation:
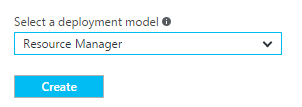
3. Select a deployment mode:
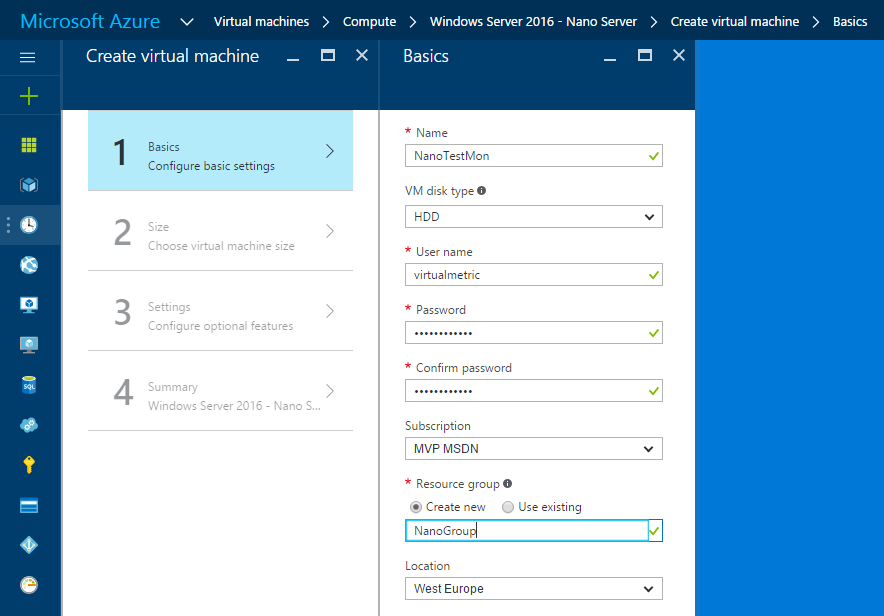
4. Fill username/password and other required informations:
5. Choose a size for your Nano Server:
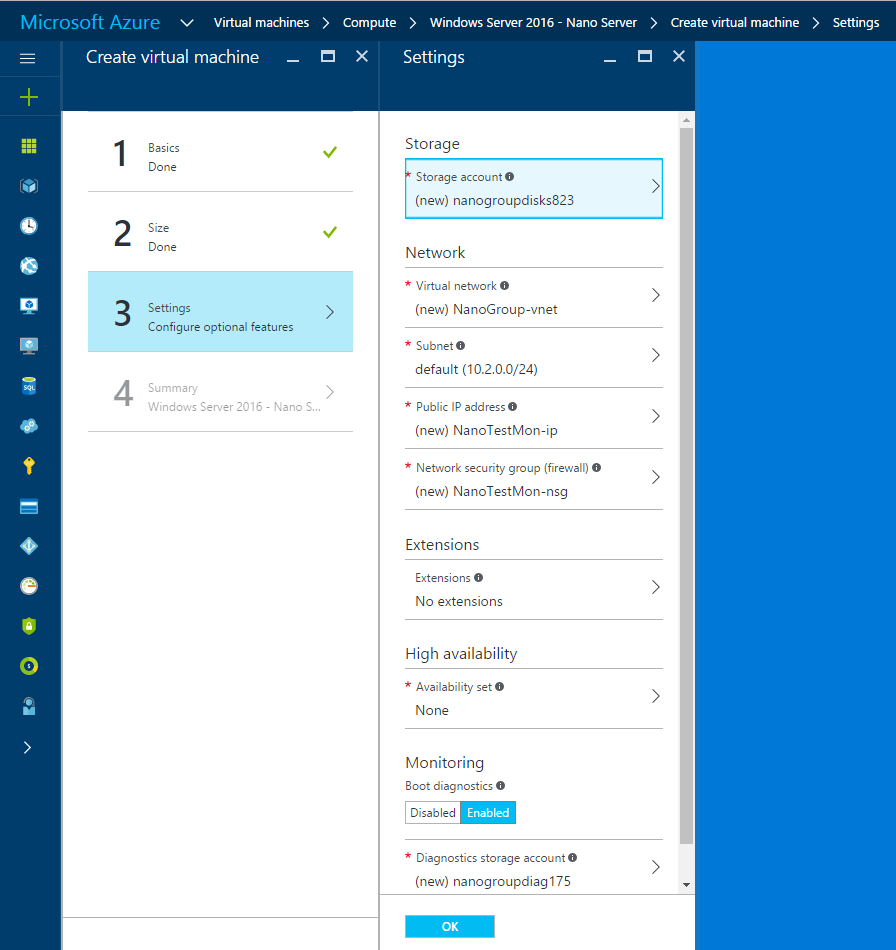
6. Confirm settings and apply:
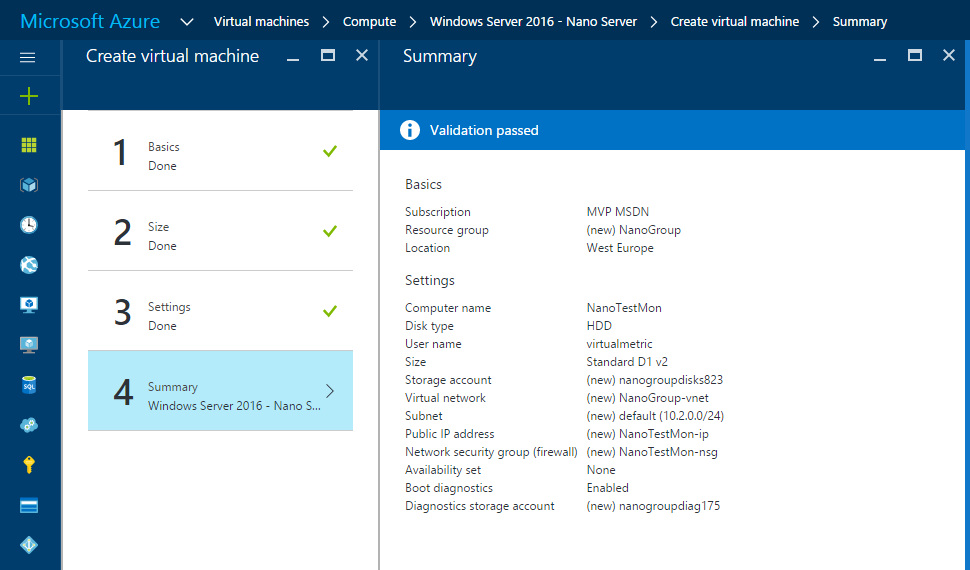
7. Validate summary and finish installation:
After Nano Server installation, we need to enable WinRM for remote connection. VirtualMetric uses WinRM to connect your Windows servers. 1. Go to network interfaces of Nano Server:
2. Choose your public interface:
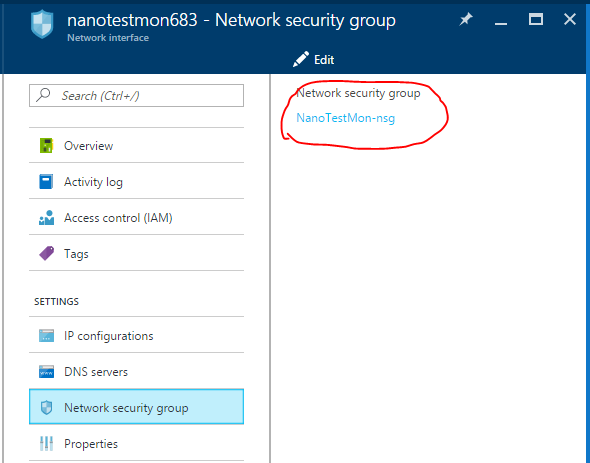
3. Click on Security Network Group to edit:
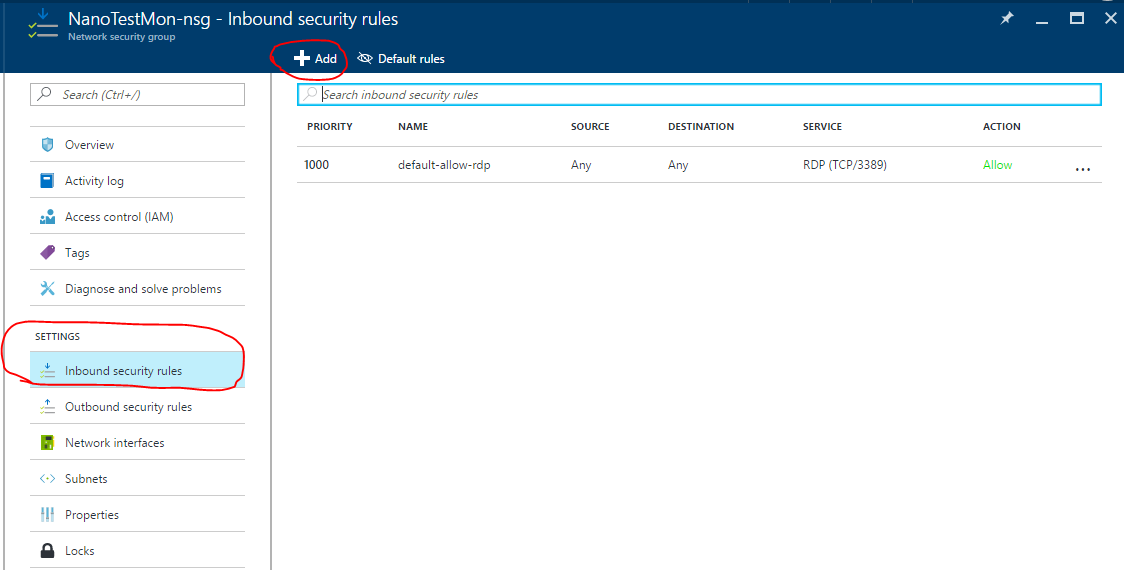
4. Click Add button to click new Rule:
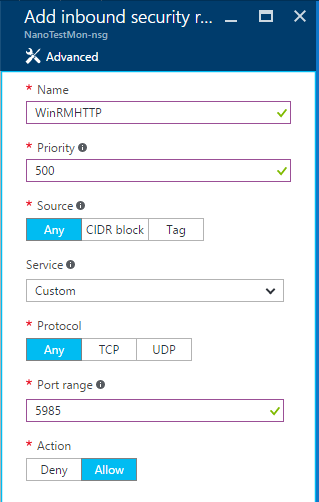
5. Create your WinRMHTTP rule like following:
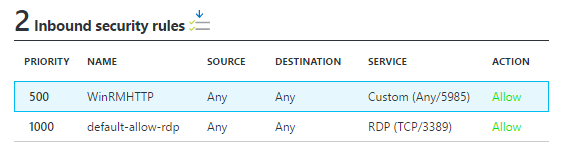
6. You should be able to see your rule in the rule list:
After finishing WinRM settings, go to VirtualMetric Dashboard and login with your username:
After login, you will see Welcome Page. Click on “Go to Settings”:
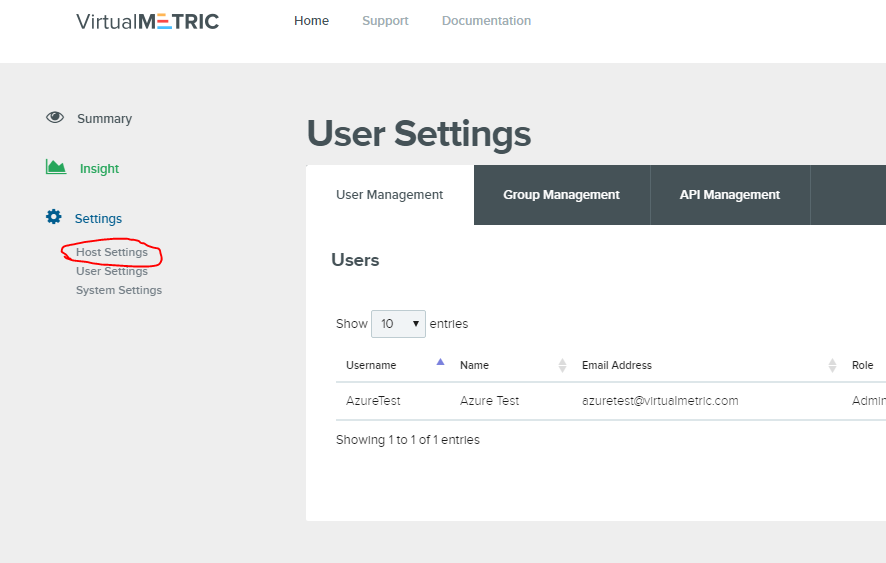
On the left menu, click on “Host Settings”:
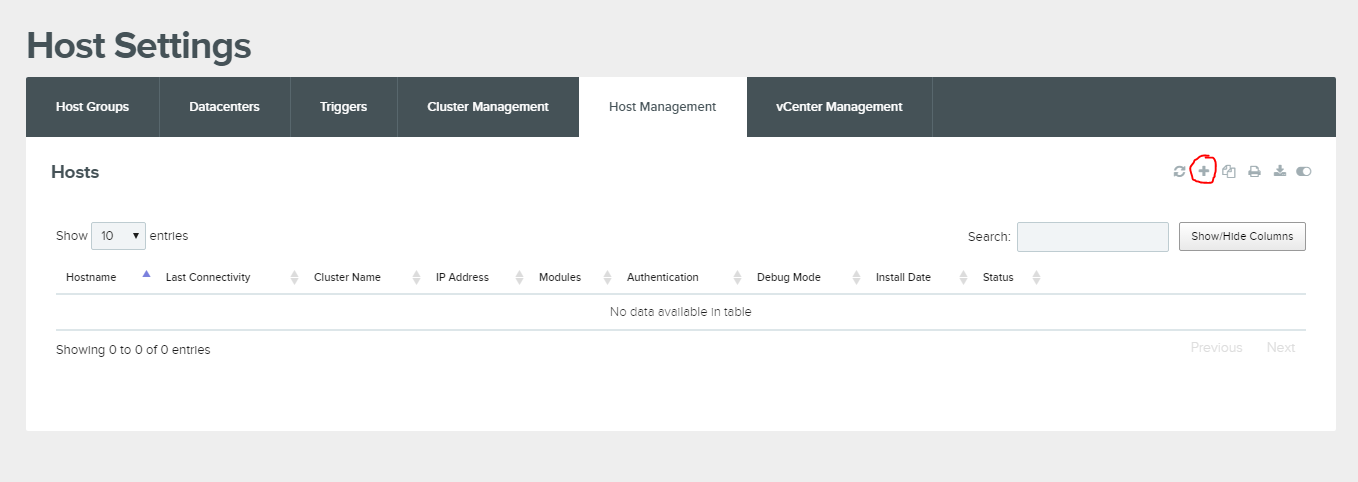
On Host Settings, go to Host Management. Click “+” icon to add Nano Server.
Enter IP address of Nano Server. Disable “Active Directory Authentication”. Type username and password of Nano Server.
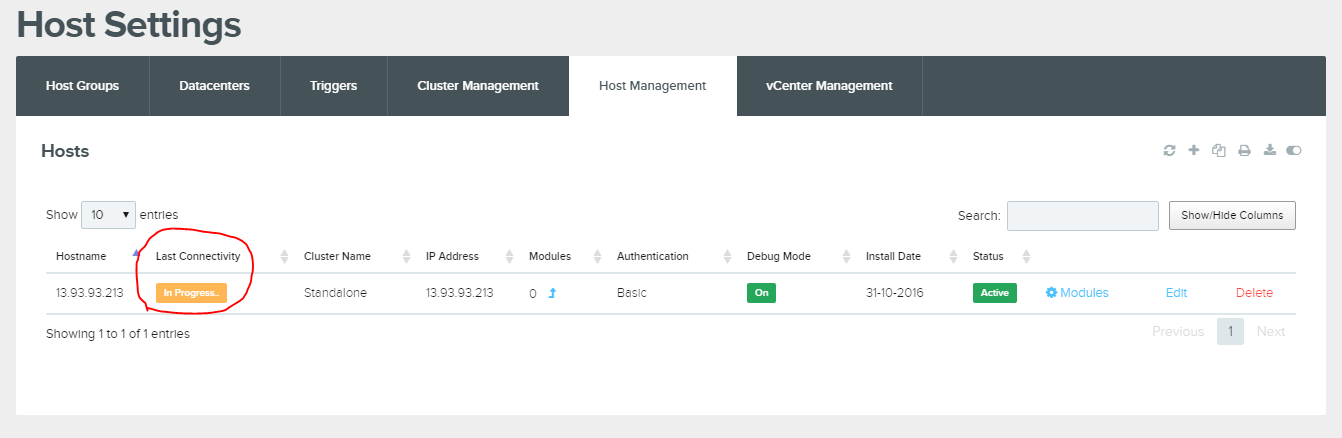
When you add your Nano Server, you will see that Host Status is “In Progress”.
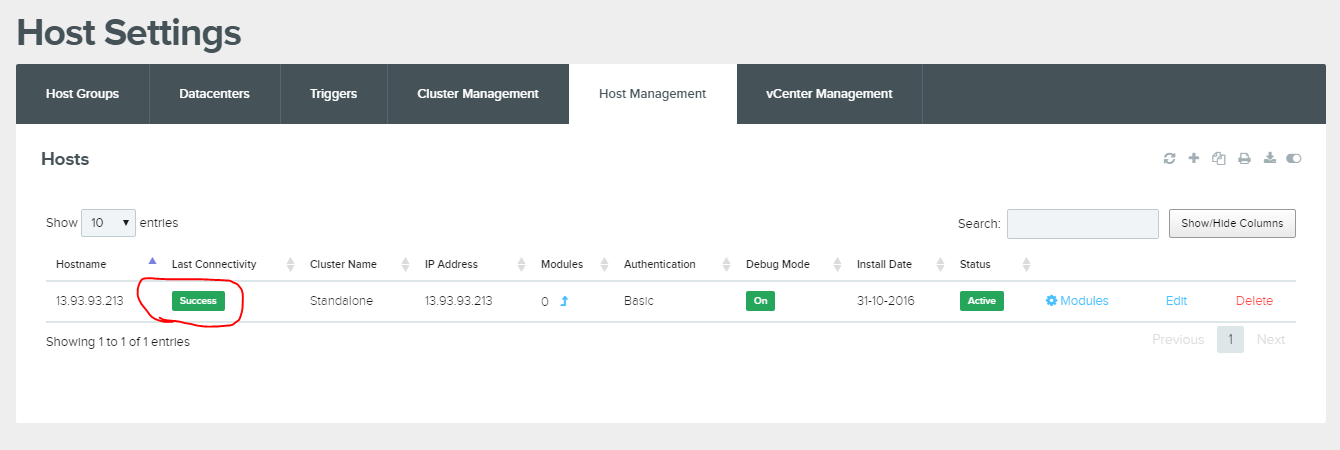
After a few seconds, you will see that VirtualMetric is connected to Nano Server.
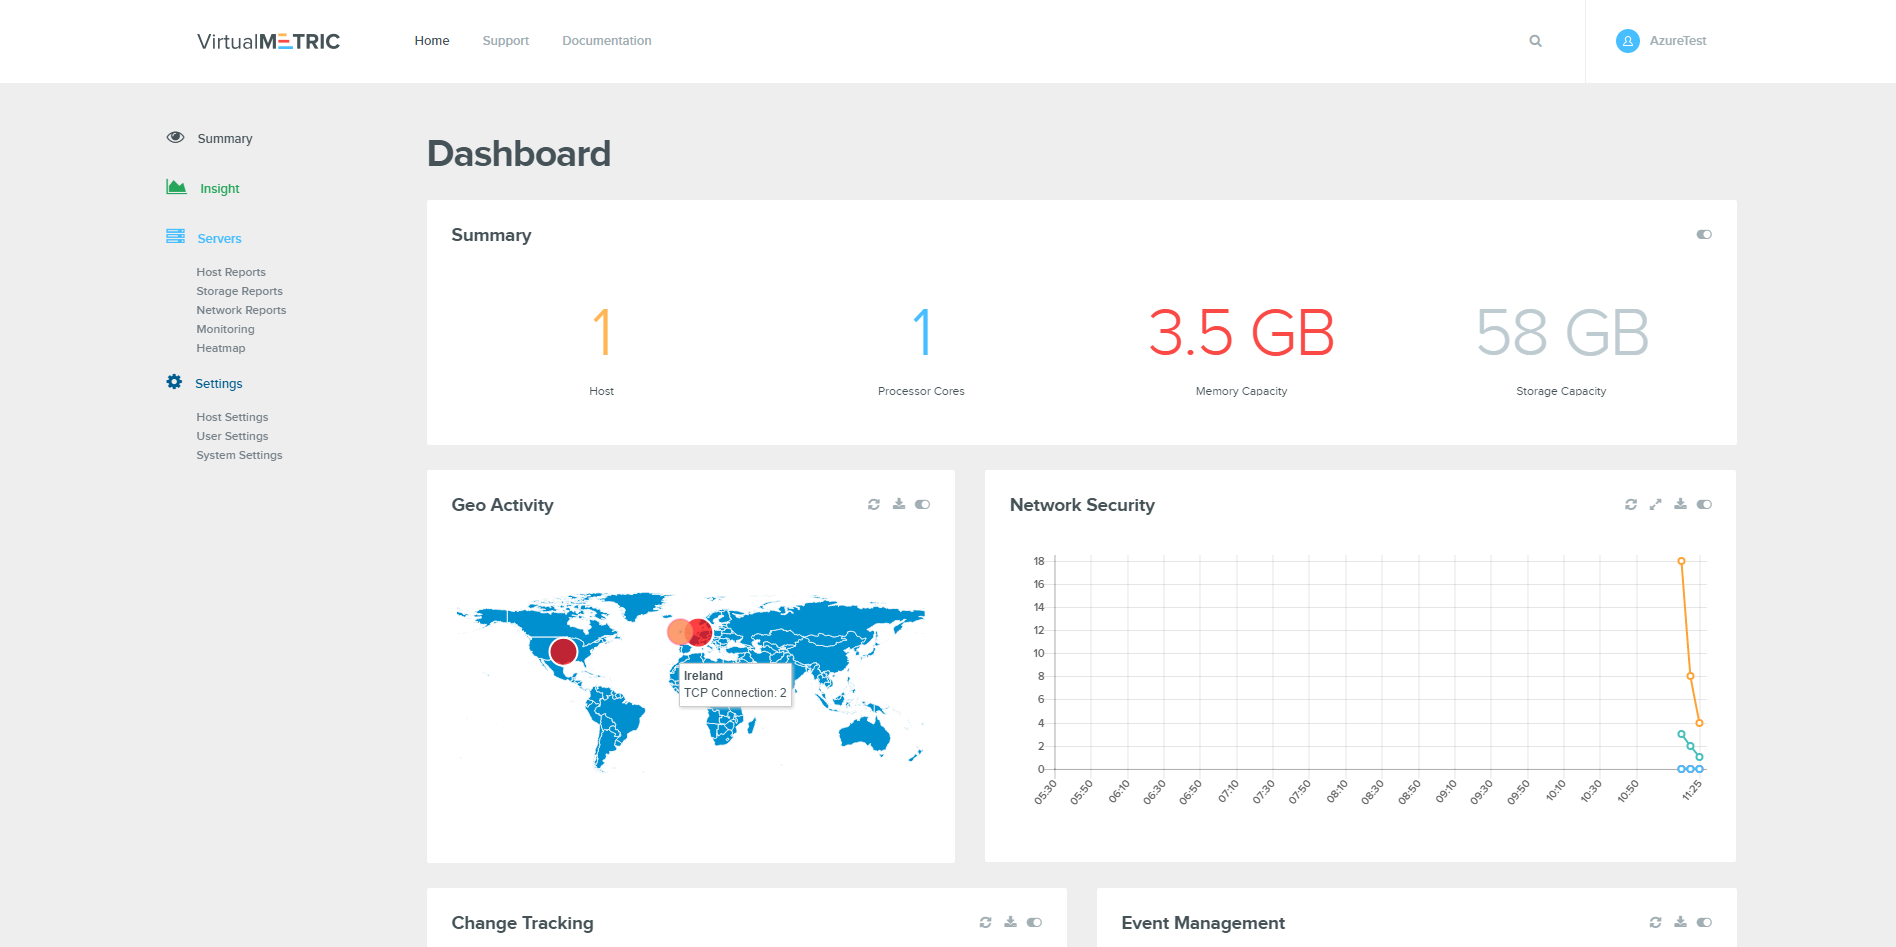
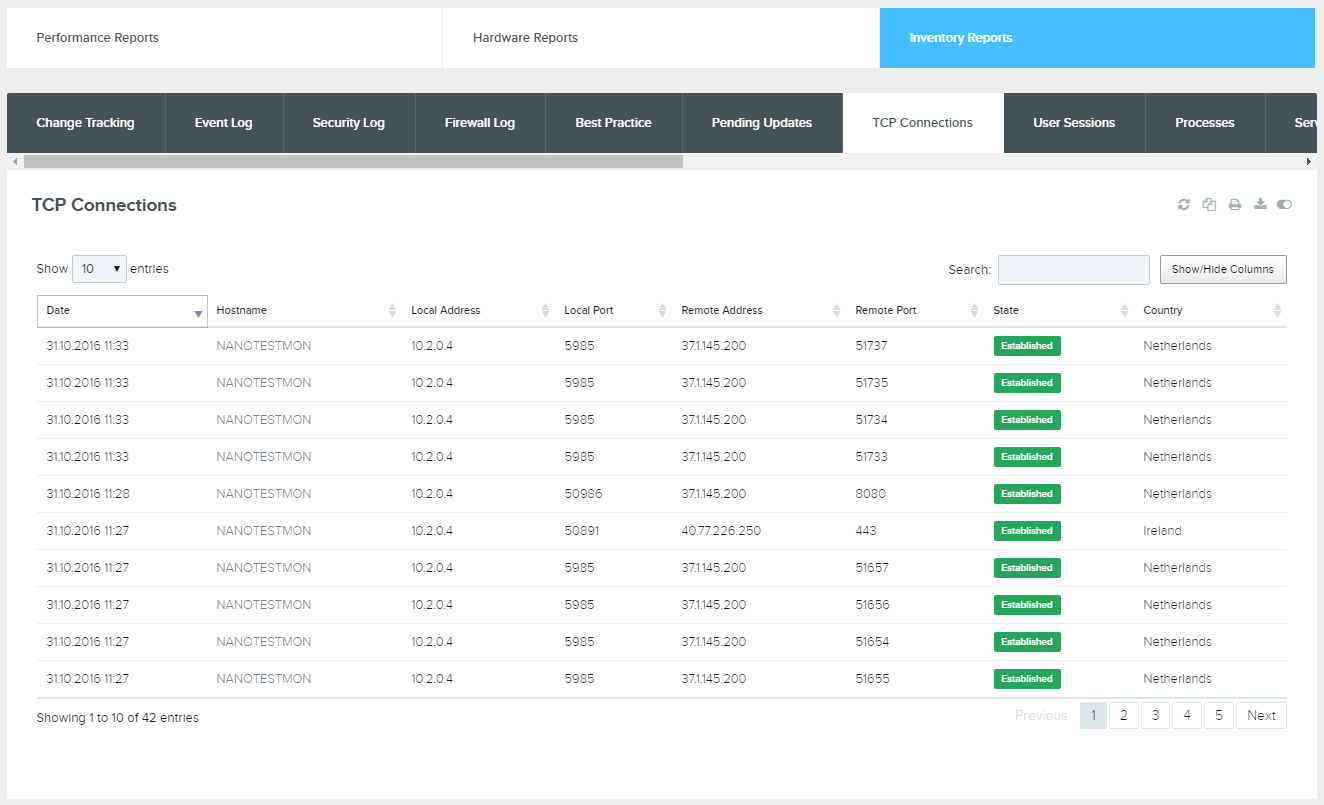
Now we can go to our Dashboard and see the results. As you see, I can see TCP connections and Geo Activity.
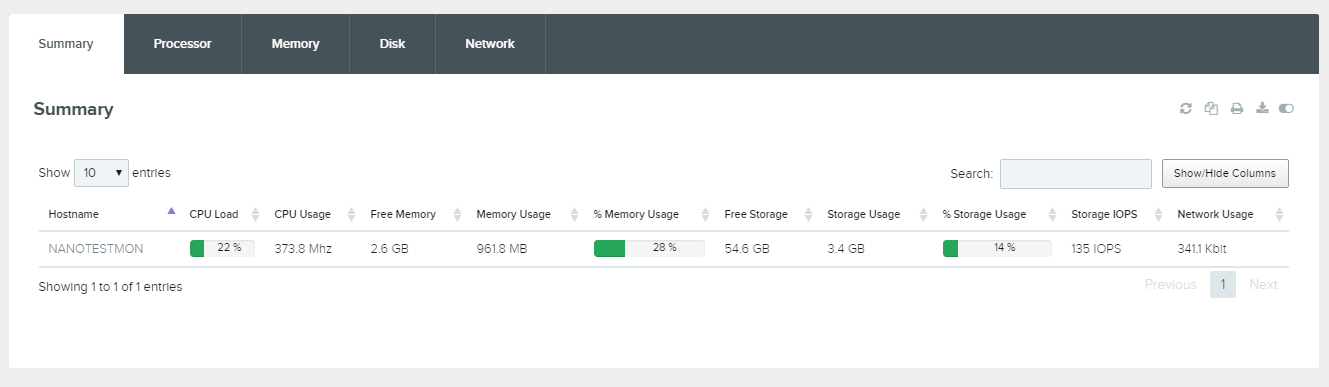
I see “Ireland” connections, probably related with Microsoft activation. Also if I go to Host Reports, I see summarized performance reports, like IO usage, memory usage etc.
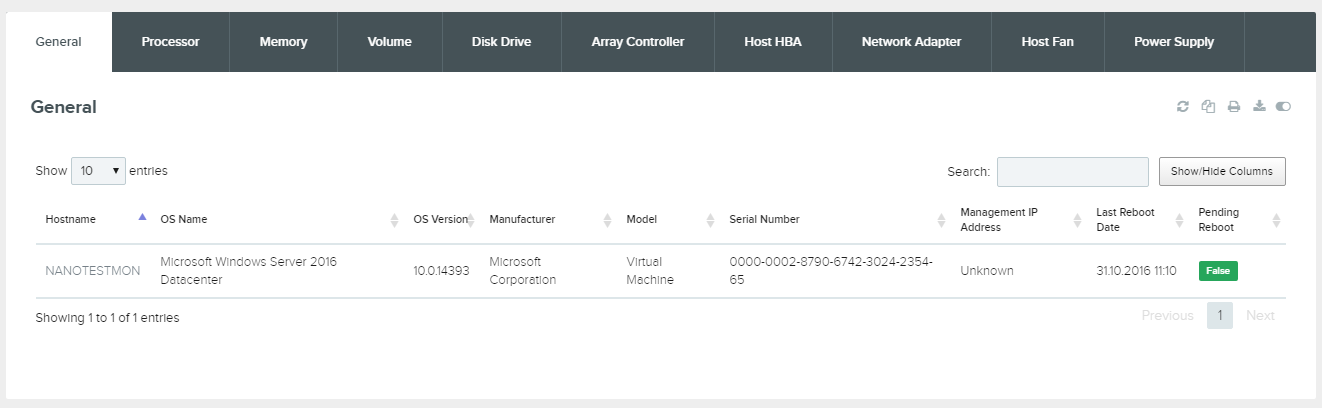
I am able to see my hardware details:
If I go to Inventory Reports, I see some changes on Change Tracking:
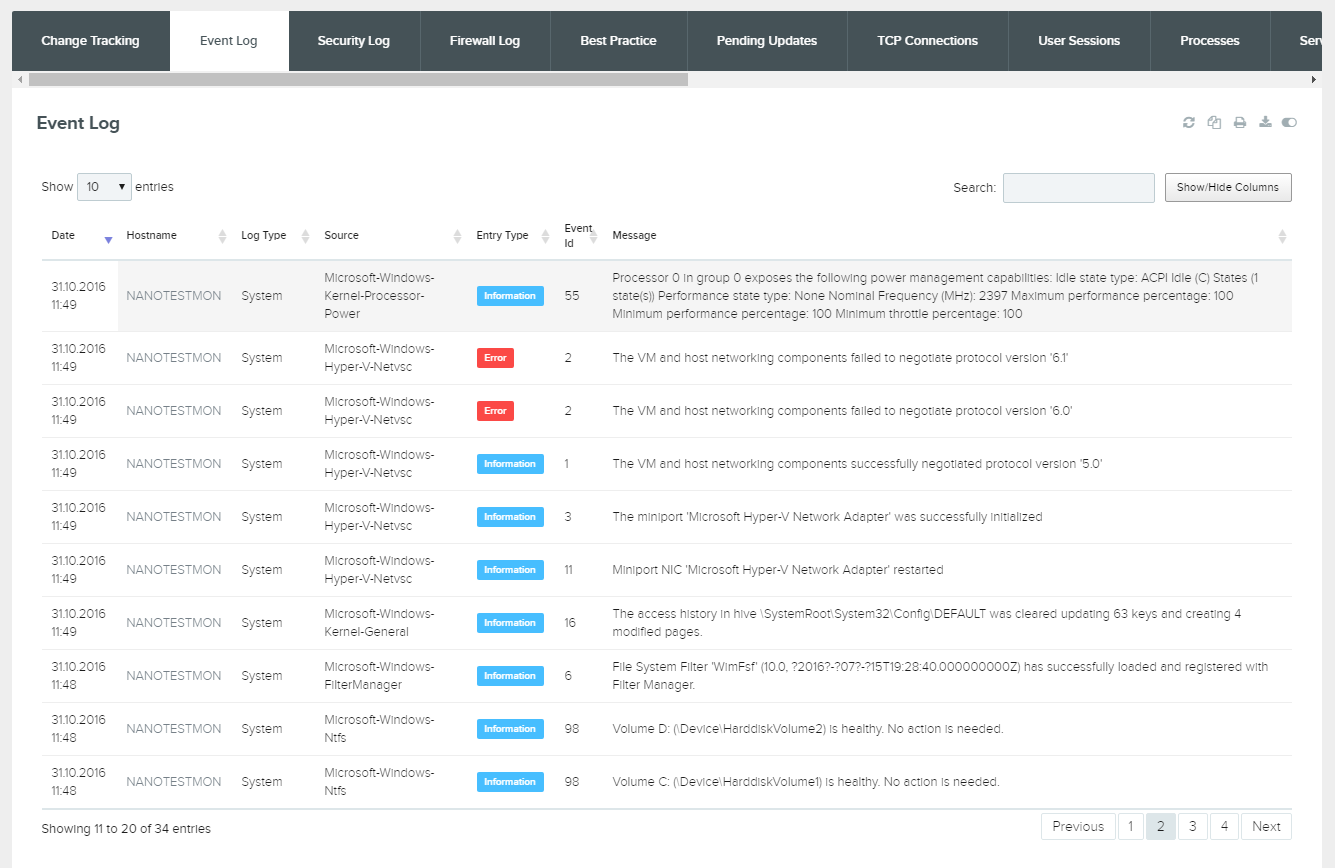
VirtualMetric can track any changes on your server like software installations, hotfix installation, config changes, server changes, hardware changes etc. In Event Logs, I see some Errors on my Nano Server but they are not important:
I am able to see Security Logs like failed logins, successful logins etc:
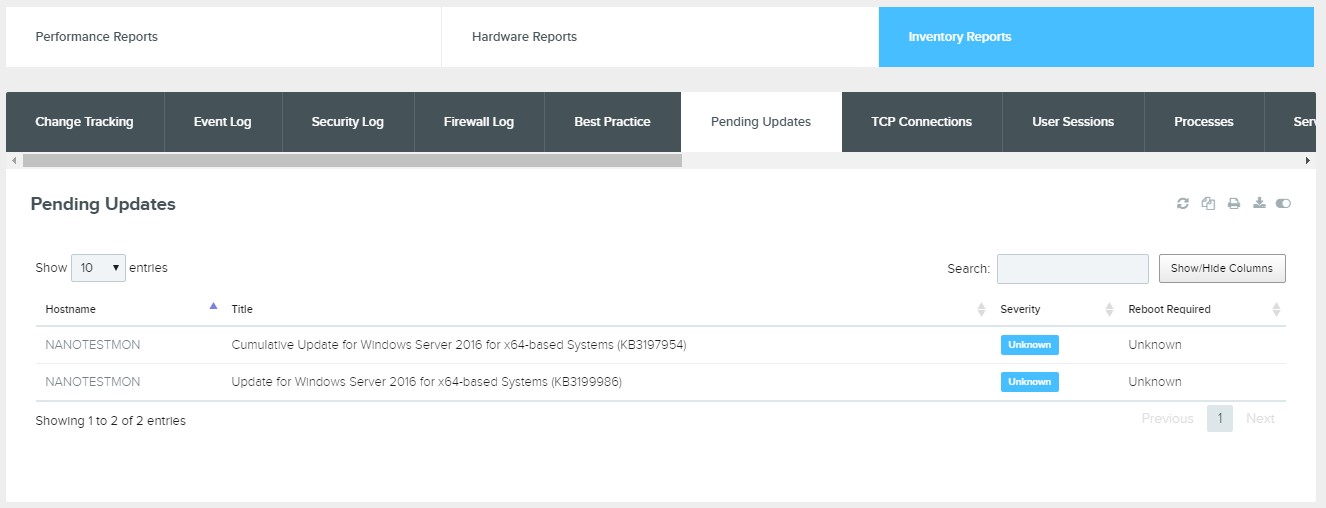
I am able to track pending updates. I see that there are 2 updates waiting on my Nano Server.
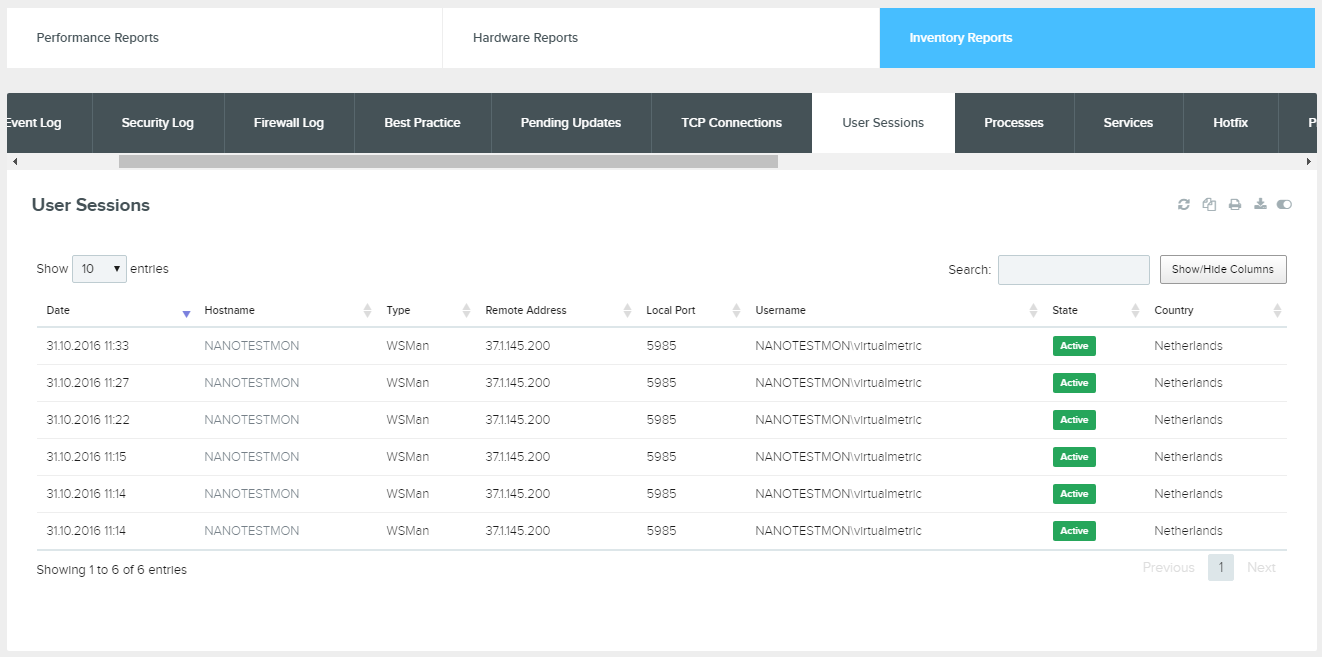
I see all TCP connections via Geo Information:
I see all User Activity:
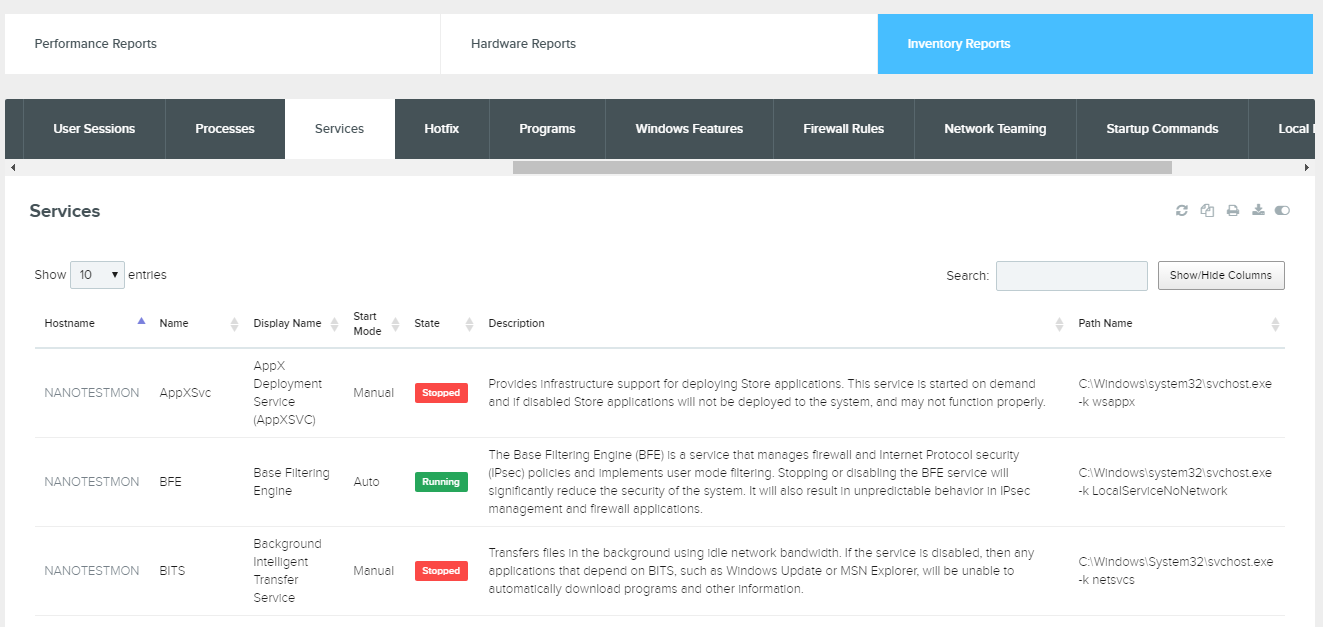
I see current Services:
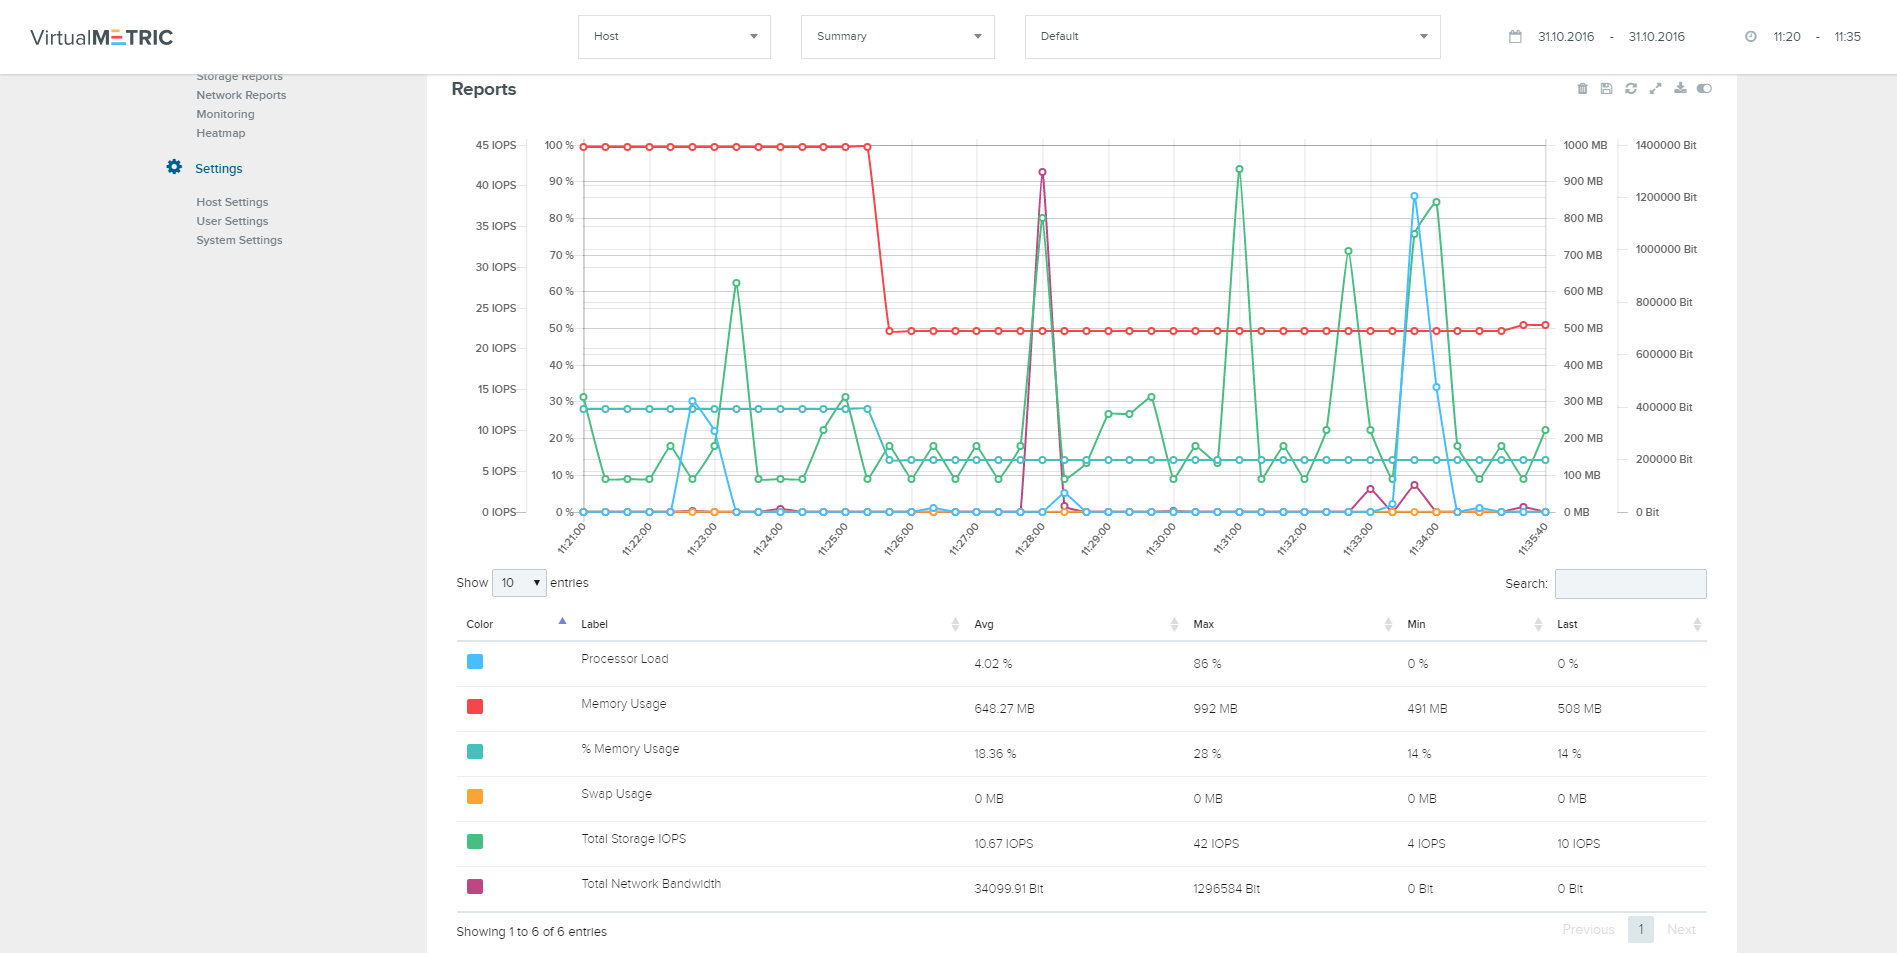
There are many other reports on VirtualMetric. But best advantage is VirtualMetric Insight. I can see all performance counters on one chart! Yes, I can see IOPS usage, Network usage and Processor usage at the same time on one chart.
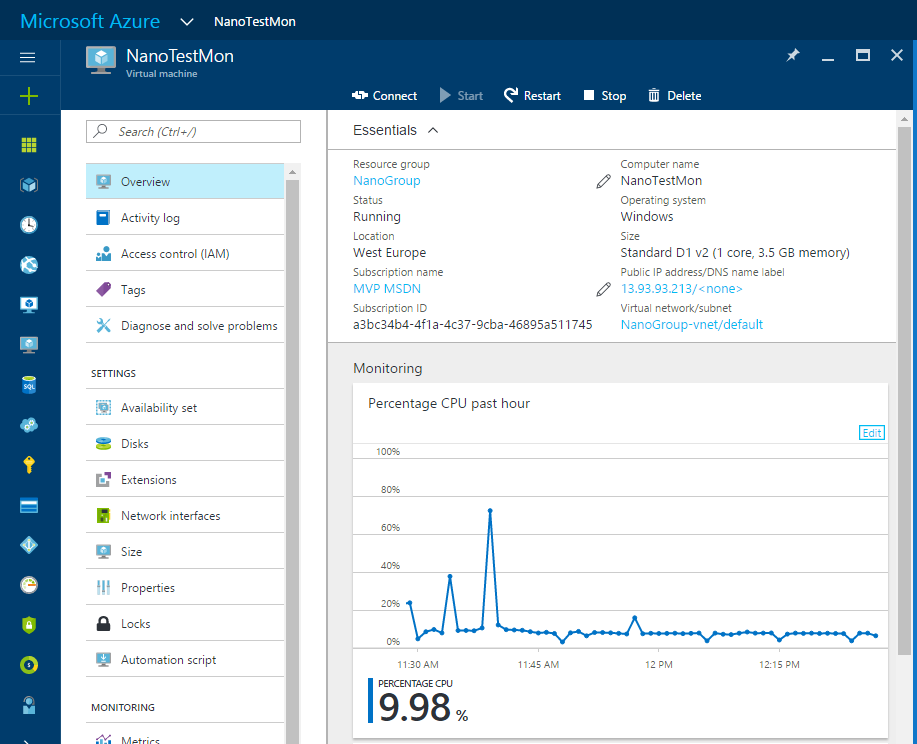
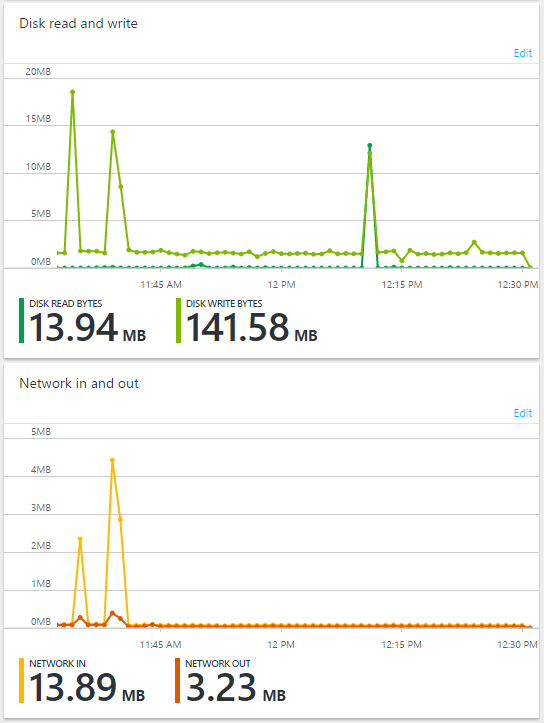
I see all performance counters with 20 seconds interval. Thats almost realtime! :) This is great. But what is performance impact on my Nano Server. Because collecting more than 100 performance counters, tcp activity and event logs could make some impact on my server. We can see this usage also on VirtualMetric, but to be objective, lets use Azure Resource Usage:
As you see, 20 seconds interval just makes %9 CPU usage (I have only one core) which is average of 24 Mhz cpu usage (according to CPU model and speed)! Also lets see other activities:
Network and Disk Activity is also almost nothing! Because VirtualMetric uses gzip to send all usage, thats why we don’t see much network usage. Disk usage is also at normal rates. As you see, I am able to monitor my Nano Server with just few clicks!
Tags: nano server inventory, nano server monitoring, windows nano monitoring, windows nano server event logs
Leave a Reply
|